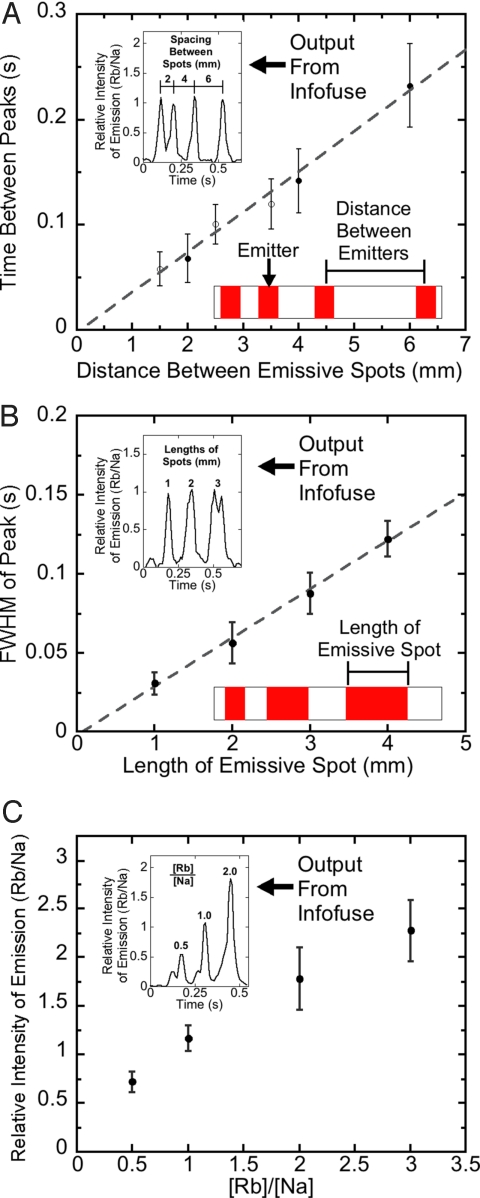
Fig. 3.
Dependence of output on physical parameters of printed emissive spots. (A) The distance between the centers of sequential spots on infofuses determined the times measured between sequential peaks. The filled circles represent spots patterned by hand; the open circles represent spots patterned by inkjet printing. (B) The length of inkjet-printed emissive spots on infofuses determined the FWHM of the temporal emissive signal. (C) The ratio of RbNO3 to NaNO3 determined the ratio of intensities of emission from Rb (IRb) and Na (INa). Each datum is the mean of at least 7 measurements; the error bars are the standard deviations of those means. (Insets) Plots of IRb/INa as a function of time.

