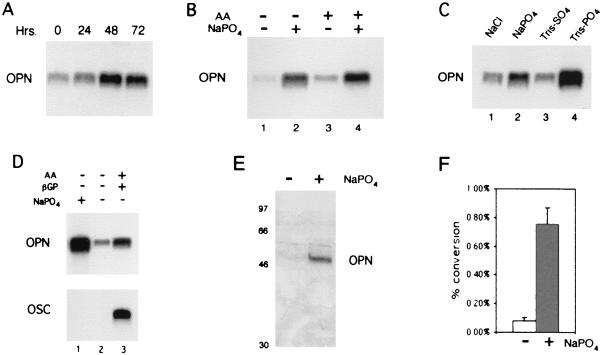
Figure 4.
Properties of phosphate-signal-regulated osteopontin expression. (A) Northern blot (NB) analysis of 12S.WT.G1 cells grown in the presence of ascorbic acid (AA) and treated with 10 mM sodium phosphate (NaPO4) for 0, 24, 48, and 72 h before harvesting the cells at day 11 for RNA isolation. (B) NB analysis of the parental cells grown in the absence (lanes 1 and 2) or presence (lanes 3 and 4) of AA and then treated (lanes 2 and 4) with 10 mM sodium phosphate for 48 h. The cells were harvested for RNA analysis at day 11. (C) NB analysis of the parental cells given growth medium for 4 days postconfluency and then treated with 10 mM NaCl, 10 mM sodium phosphate, 10 mM Tris-sulfate (TrisSO4), or 10 mM Tris-phosphate (TrisPO4) for 60 h and harvested for RNA analysis. (D) NB analysis of preconfluent MC3T3-E1 (lanes 1 and 2) and day 21 (lane 3) probed with osteopontin (OPN) and osteocalcin (OSC). Treatment conditions are stated above each lane. (E) Western blot analysis of osteopontin in response to 10 mM sodium phosphate. Preconfluent MC3T3-E1 were treated in the presence or absence of 10 mM sodium phosphate for 48 h and analyzed by PAGE. Membranes were probed with the osteopontin-specific antibody LF-123. (F) CAT assay analysis of the osteopontin promoter in response to 10 mM sodium phosphate. Transiently transfected cells were treated with either sodium sulfate (white bar) or sodium phosphate (shaded bar). The graph shows the percentage conversion of chloramphenicol to acetylated forms.

