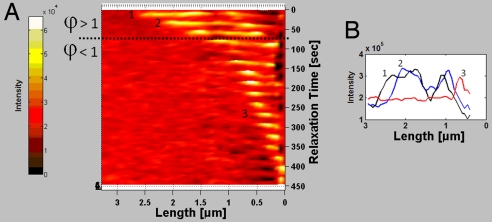
Fig. 4.
In vivo chromatin relaxation. (A) In vivo chromatin relaxation montage with fluorescent intensity mapped to color. The region of decreased intensity between the 1.5 and 1 μm length, and near the base of the molecule is the result of an image processing routine implemented to remove out of plane fluorescence caused by other (nonchromatin) structures. The unaltered image is shown in Fig. S5 and Movie S1. (B) Fluorescence intensity trace along the length of the retracting molecule for 3 frames of the relaxation event.

