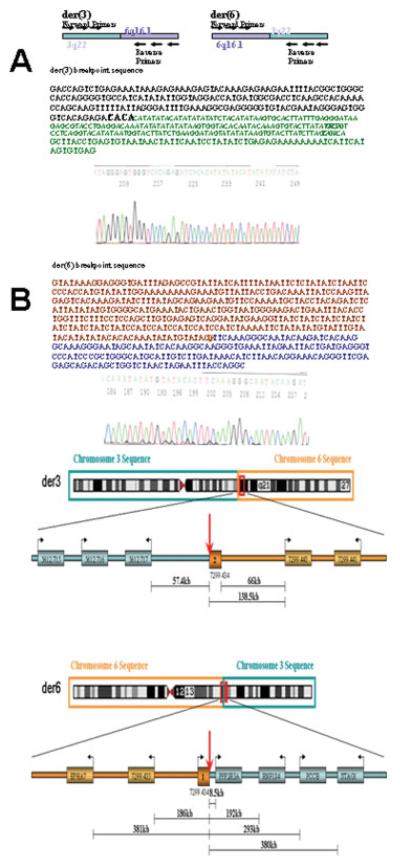
Figure 2.
Panels A and B show breakpoint region sequences for derivative chromosome 3 (Panel A) and derivative chromosome 6 (Panel B) (see text for details). Panel C illustrates the location of genes in relation to translocation breakpoints. [Color figure can be viewed in the online issue, which is available at www.interscience.wiley.com]

