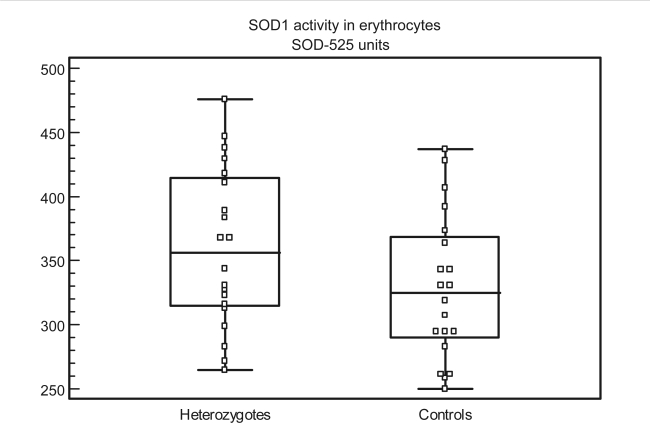
Figure 1.
Distribution of individual values of SOD1 activity in heterozygotes and controls (SOD-525 units in erythrocytes). The central box represents the values from the 25th to the 75th percentile (314–414 in heterozygotes and 289–368 in the controls). The middle line represents the median in the patients and the controls (354 and 325), respectively. The horizontal lines represent the lowest and highest value, (265 and 476) in heterozygotes, (250 and 437) in controls.
Abbreviation: SOD1, Cu-Zn superoxide dismutase.

