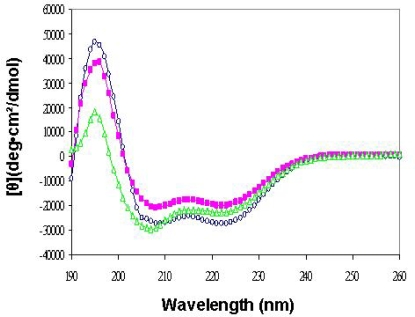
Figure 3.
Represenatative Circular Dichroism (CD) analysis of some of the purified proteins. Spectra were obtained at 4° C in PBS buffer (pH=7.4). (
 ) CD spectra of hTim16/Pam16s (
 ) CD spectra of yTim14/Pam18s-hTim16/Pam16s complex (
 ) CD spectra of hTim14/Pam18s/-hTim16/Pam16s complex. Similar spectra were obtained for all constructs presented in Table 1.

