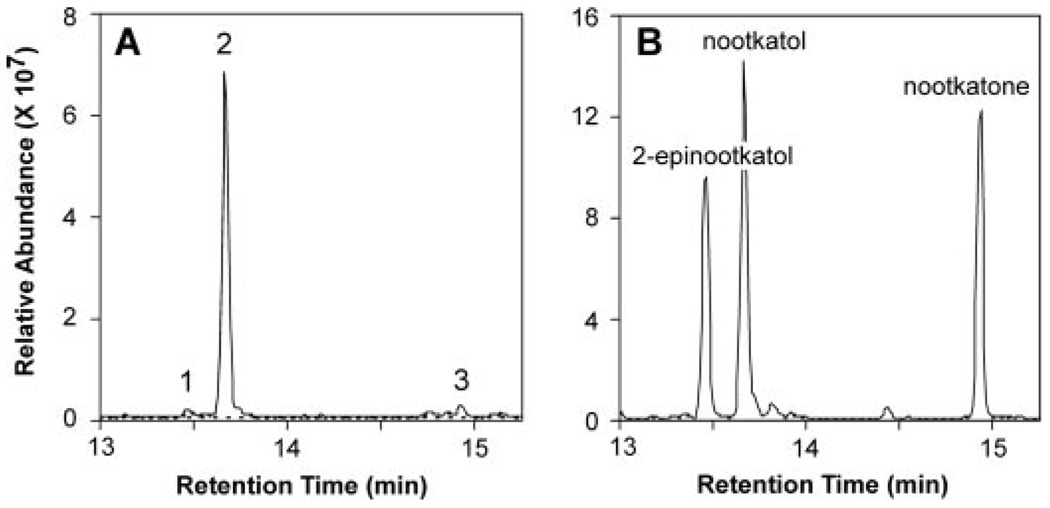
FIGURE 3. Reaction product analysis of HPO incubations with valencene.
Shown are total ion chromatograms for reaction products generated by HPO in the presence (solid line) and absence of NADPH (dotted line). Assays were incubated with 40 µm valencene for 10 min before extracting the reaction products into ethyl acetate. Total ion chromatograms of the reaction products (A) in comparison to those for standards of 2-epinootkatol, nootkatol, and nootkatone (B). (Relevant mass spectra are shown in supplemental Fig. S3.)

