
Figure 1.
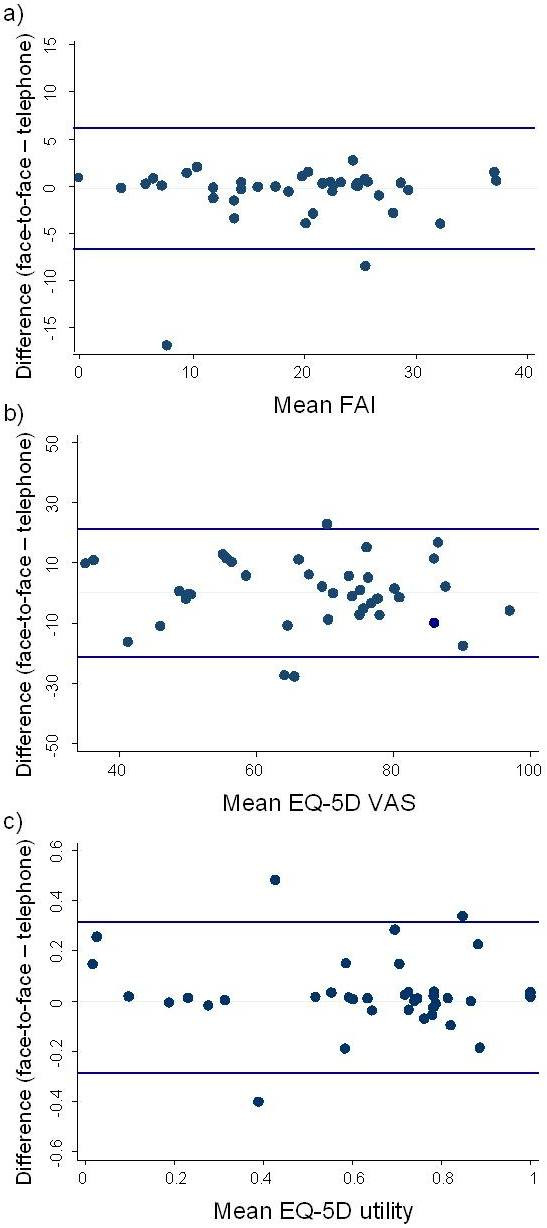
Bland Altman plots for Frenchay Activity Index (a), EQ-5D VAS (b) and EQ-5D utility (c).
Official websites use .gov
A
.gov website belongs to an official
government organization in the United States.
Secure .gov websites use HTTPS
A lock (
) or https:// means you've safely
connected to the .gov website. Share sensitive
information only on official, secure websites.
Bland Altman plots for Frenchay Activity Index (a), EQ-5D VAS (b) and EQ-5D utility (c).