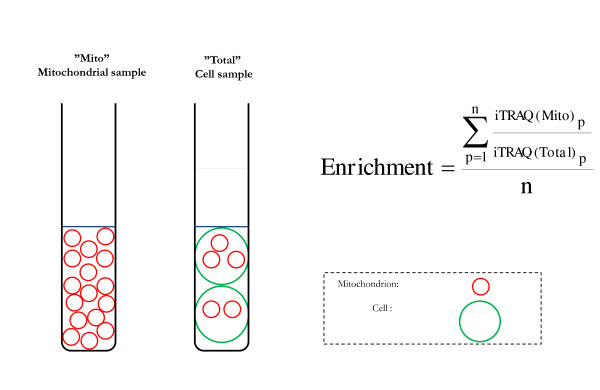
Figure 1.
Schematic picture describing the mitochondrial enrichment factor. The mitochondrial enrichment factor was calculated as the average amount of 39 mitochondrial proteins (n = 39) in mitochondrial sample compared with the total cell sample. The enrichment factor represents an indirect measure of the relative amounts of mitochondrial proteins in the different fibroblast cultivations.

