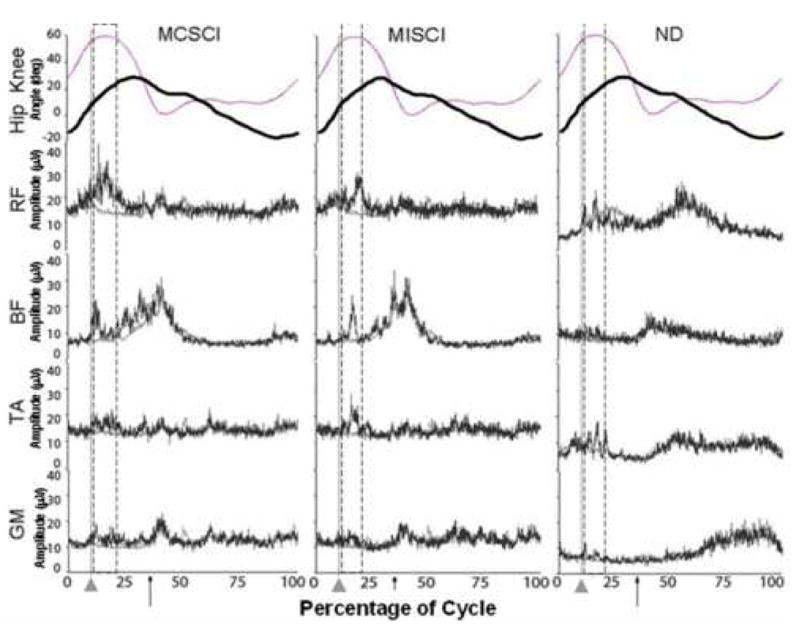
Figure 2.

Exemplary individual EMG recordings from ipsilateral leg muscles from each of the subject 3 groups (MCSCI, MISCI, ND) in response to an early hip (EH) perturbation (dark trace) compared to background EMG (light trace). Percent of cycle is given with onset of swing phase representing cycle onset, light vertical line and pointer indicate onset of perturbation, arrow represents onset of stance phase (heel strike). Bracketed region represents period falling 30ms – 200ms after the perturbation onset. The knee (light trace) and hip (dark trace) angles are also noted.
