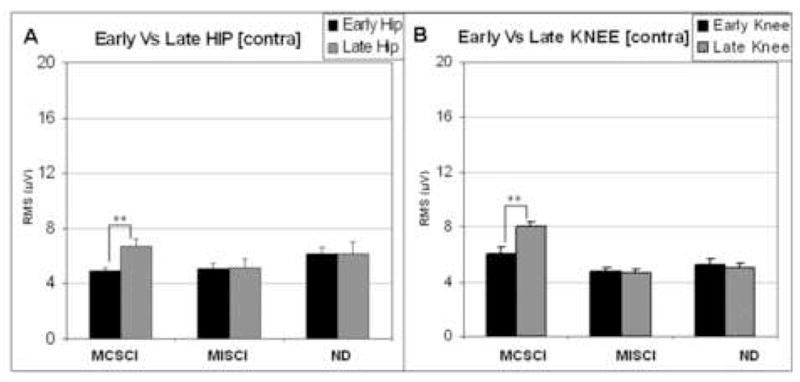
Figure 5.

Mean muscle burst amplitude (RMS) in the contralateral limb associated with responses to early and late perturbations at the hip (A) and knee (B) in each of the three subject groups. Black bars = early responses, Gray bars = late responses. Error bars indicate standard error of the mean (SEM). Significant differences in response due to timing of the perturbation are indicated by asterisks (**: p<0.001).
