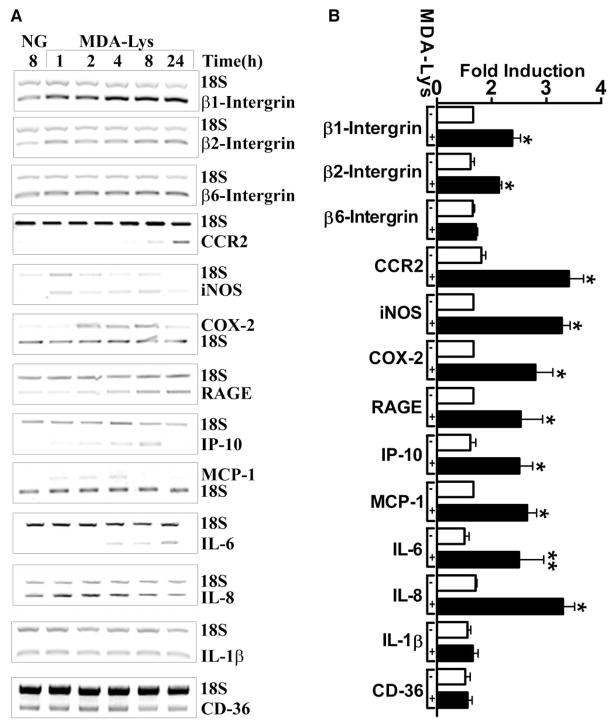
FIG. 2.
Analysis of MDA-Lys-induced candidate genes. Relative RT-PCRs were performed with total RNA isolated from THP-1 cells treated with or without MDA-Lys for 1–24 h, using gene-specific primers (Supplemental Table S1). 18S RNA primers were included in each PCR reaction as internal control. A: Ethidium bromide-stained agarose gels of RT-PCR products. NG indicates control cell grown for 24 h. B: Bar graph showing significant induction of β1- and β2-integrins, CCR2, iNOS, COX-2, RAGE, IP-10, IL-6, IL-8, and MCP-1 mRNAs at 4, 8, or 24 h. Values shown are means ± SE of three independent experiments. *P < 0.001, **P < 0.05 vs. normal glucose.

