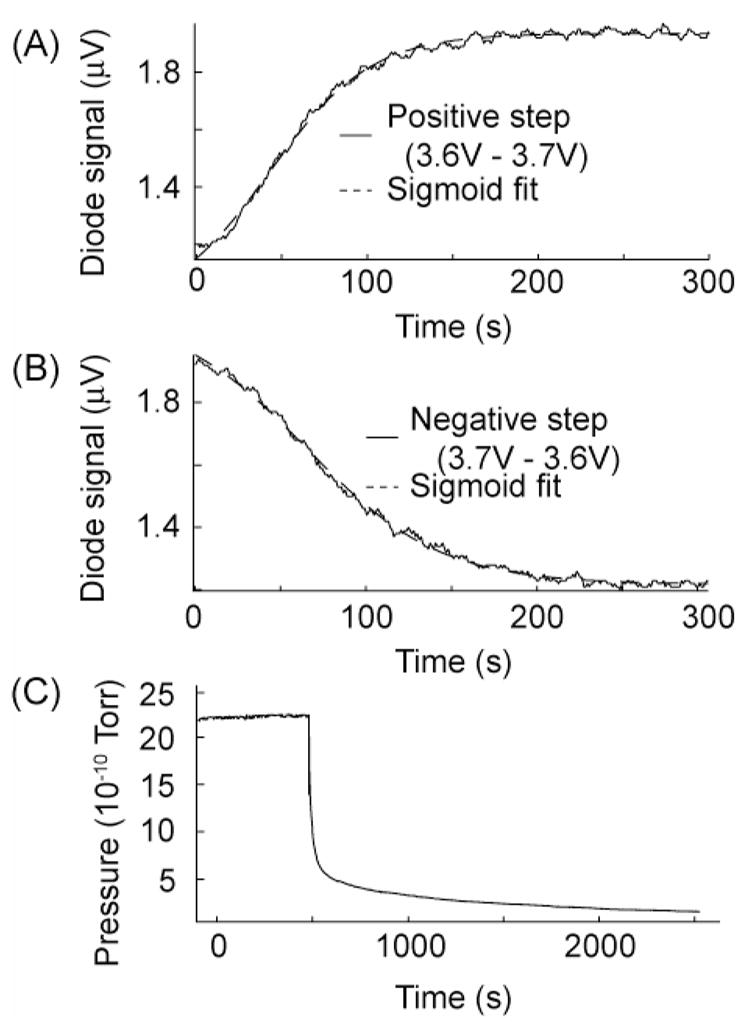
Figure 22.

Representative transient response of the gyrotron to (A) positive and (B) negative step in the control voltage. The dashed line is a sigmoidal fit to the data from which optimal PID parameters were estimated. Note oscillations in the output power which persist even though the system is not under proportional regulation for these measurements. (C) Response of the system to termination of running power supplies following thirteen hours of CW operation.
