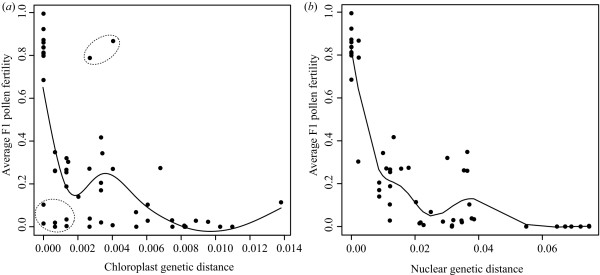
Figure 7.
Nonlinear, single regression of average F1 pollen fertility (a) against average parental chloroplast genetic distance (K81uf + G model of nucleotide substitutions with gamma shape = 0.2834) and (b) against the average parental nuclear genetic distance (Tamura--Nei + I + Γ model of nucleotide substitutions with gamma shape = 0.8578, proportion of invariable sites = 0.3018). Dashed circles indicate data points showing strong discordance between chloroplast genetic distance and average F1 pollen fertility.

