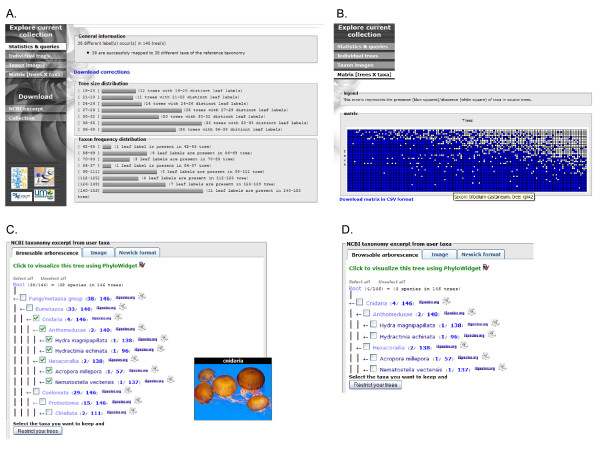
Figure 3.
Snapshots of PhyloExplorer's tree collection description and restriction features. The 146-individual gene tree collection from the phylogenomic study of Delsuc et al. [32] [see Additional file 2] has been uploaded. A) PhyloExplorer produces statistics depicting the user tree collection in the form of simple tree size and taxon distribution histograms. B) Data availability matrix scoring the presence/absence of taxa in trees from the collection. C) Excerpt of the reference taxonomy (here NCBI) containing all mapped taxa from the tree collection with associated statistics at each node. For each taxonomic group, the number of its representatives found within the tree collection and for each taxon the number of user trees where it is represented. Here, all members of Cnidaria are selected from checkboxes to restrict the trees to members of this phylum. An illustrative picture is automatically popped up from the Wikispecies page for Cnidaria. D) Summary NCBI excerpt of the tree collection restricted to Cnidaria with adjusted statistics.

