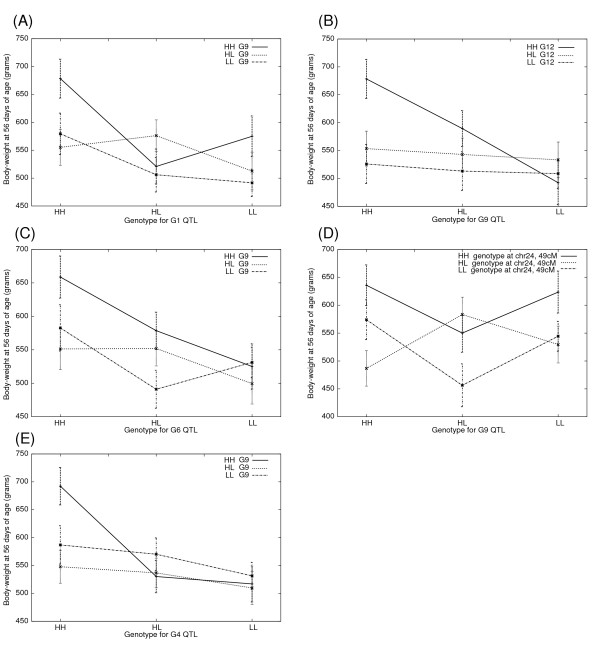
Figure 3.
Genotype-phenotype plots for genome-wide significant epistatic QTL pairs for body-weight at 56 days of age (A-E). The mean values of body-weight (in grams) for each of the nine possible allelic combinations are shown in the plot. The genotype classes for one QTL are listed on the X-axis (i.e. HH, HL and LL) and the curves represent each genotype class of the other QTL. Error bars represent the standard error of mean (s.e.m). HWS alleles are abbreviated as "H" and LWS alleles as "L".

