
Figure 1. 2D gel electrophoresis of PSML.
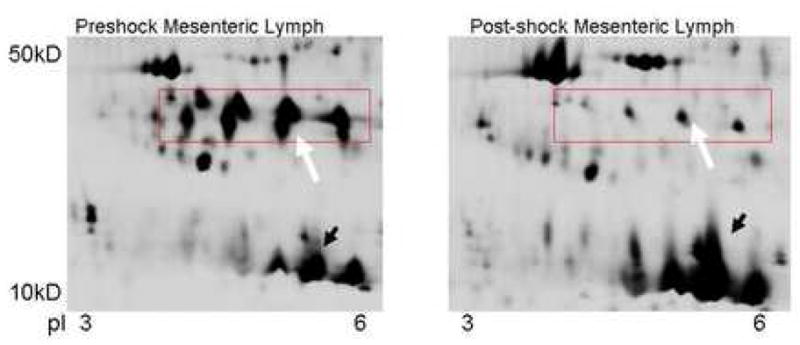
2D gel electrophoresis illustrates differences in several proteins despite equal protein loading. Although, many proteins decreased in the post-shock sample (box with white arrow) some proteins increase in concentration (black arrow) suggesting a selective process. Computerized and manual spot picking were used to identify proteins with significant changes when comparing the pre and post-shock samples which were then analyzed via mass spectrophotometry.