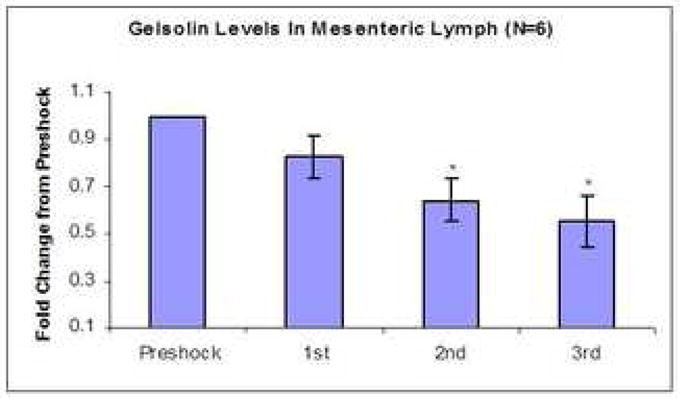
Figure 2.


Figure 2a: Western blot of gelsolin in PSML. Each hourly sample was loaded on the SDS-PAGE gel at equal protein concentrations. Analysis by densitometry using a loading control from the ponceau stain shows sequentially decreasing levels in each hour of the post-shock samples.
Figure 2b: Average lymph gelsolin levels. Lymph samples were loaded on SDS-PAGE gels at equal protein concentrations and compared to subsequent hours during and after resuscitation. The overall gelsolin levels decrease sequentially with each subsequent hour of resuscitation and continue to fall after completion of resuscitation during the final hour of the experiment (*p<0.01, n=6).
