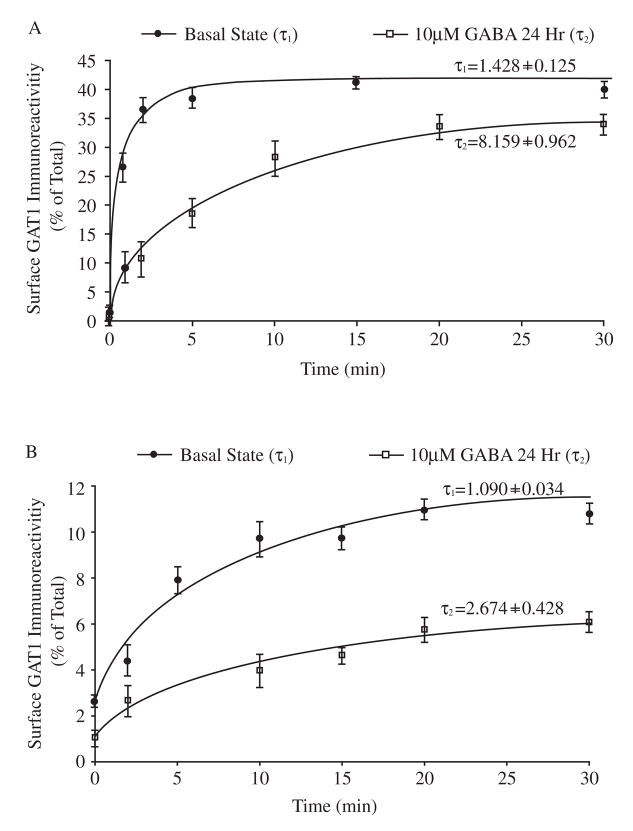
Fig. 3.
Long-term GABA treatment alters GAT1 endocytosis and exocytosis rates. A, the exocytosis rate of GAT1. Data from six experiments show the time course of surface GAT1 expression in the basal state (filled circles) and after treatment with GABA for 24 h (open squares). Transporters on the plasma membrane, after incubation for different time periods at 37 °C, were compared to the calibrated standards of total surface GAT1 to quantify exocytosis. Time constant τ1 (basal state) and τ2 (24 hr) were obtained by fitting data to the exponential function Tt=T0+A(1-e (−t/τ). B, the endocytosis rate of GAT1. Transporters internalized after incubating for different time periods at 37 °C are compared to the calibrated standards of total surface GAT1. Data are collected from seven experiments. The values and symbols are as described in A.

