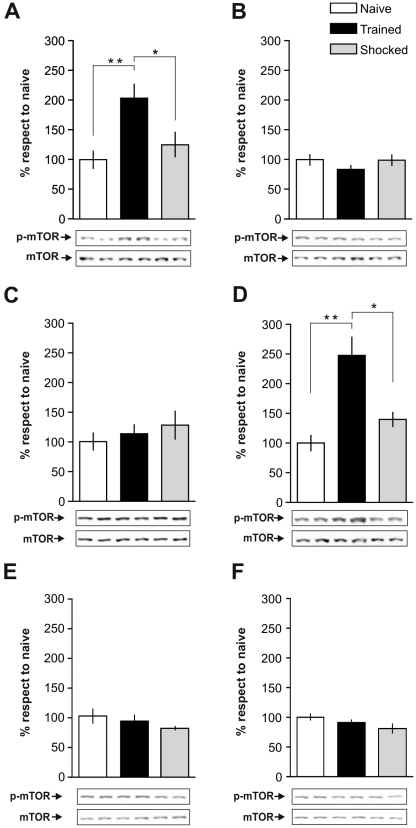
Figure 1. IA Training Is Associated with Two Time Windows of mTOR Activation in the Hippocampus.
Bars represent the mean p-mTOR/mTOR ratio of trained (black) or shocked (gray) groups respect to naïve (white) group, sacrificed immediately (A), 15 min (B), 1 h (C), 3 h (D), 9 h (E) or 12 h (F) after IA training. Data are expressed as means±SEM of p-mTOR/mTOR ratio; *p<0.05, **p<0.01. Representative blots of phosphorylated and total protein levels of mTOR are shown in the lower panels. n = 5–6 per group for each experiment.

