
Figure 2.
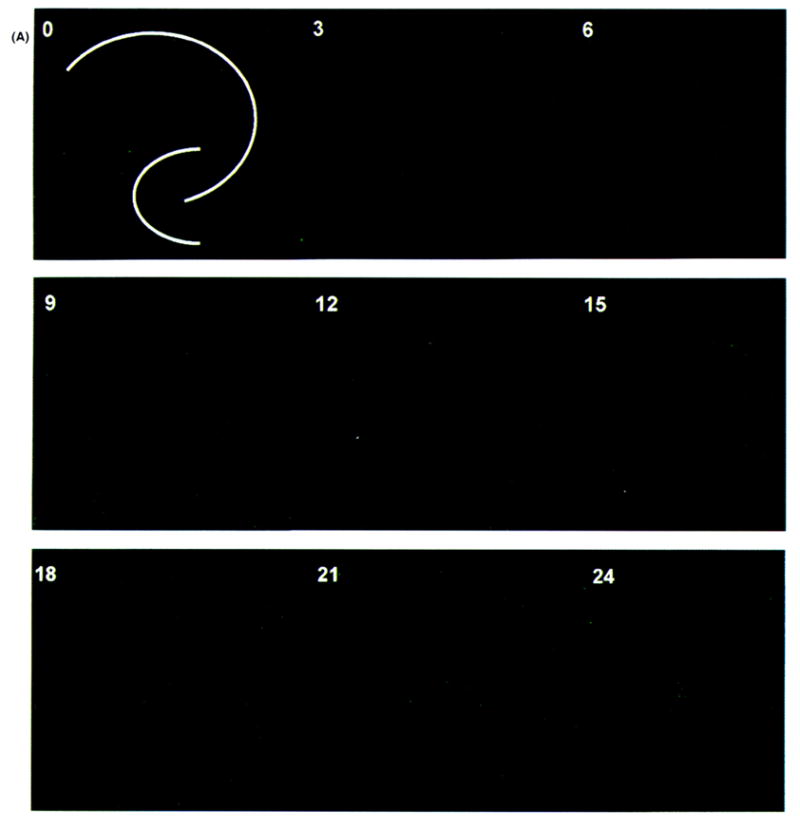
Evolution of irreversible neural injury from N-methyl-D-aspartate (NMDA) exposure. Images shown are time-lapsed using Sytox (Molecular Probes, Eugene, OR, U.S.A.) as a fluorescent indicator of cell lysis. Sham control hippocampal organotypic cultures (HOTCs) were exposed to Ringer’s solution (A) and experimental HOTCs to Ringer’s solution plus 10 μM NMDA (B) for 30 min at room temperature. Test solutions were removed and cultures reexposed to normal growth medium in an incubator at 37°C with 5% CO2/balance humidified air. Cultures were briefly removed (at times indicated in hours in the upper left-hand corner of images) and photographed. White lines in 0-h images show pyramidal cell body layer and dentate gyrus for all images. Notice that in sham control cultures (A), only a few cells show cell necrosis (e.g., especially at 21 or 24 h). On the other hand (B), a pronounced and progressive increase in necrosis is seen in the CA1 area from 15 to 24 h after exposure to 10 μM NMDA. Bar = 500 μm.