
Figure 4.
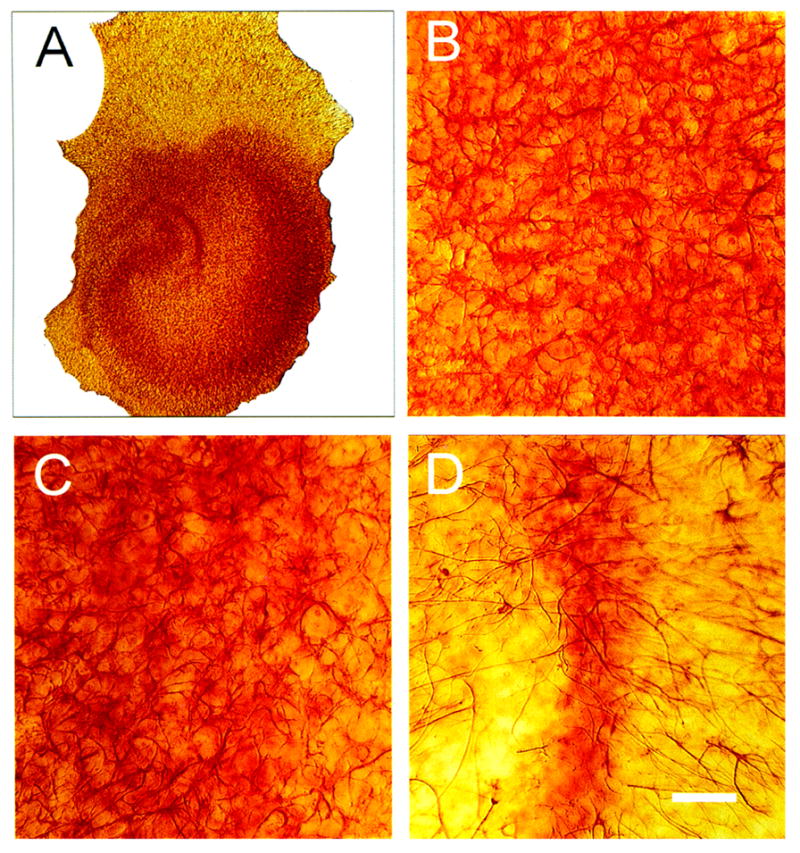
Bright-field photomicrographs of glial fibrillary acidic protein (GFAP) immunostaining (IS) 48 h after 10 μM N-methyl-D-aspartate (NMDA) exposure in hippocampal organotypic cultures (HOTCs). Low-power image (A) shows typical CA1, CA3, and DG cell layer orientation. Exposure to NMDA caused GFAP IS to increase in CA1 (B) and CA3 (C) areas. Notice the enlarged cell bodies throughout images in these areas compared with their respective counterparts in normal HOTCs (Fig. 3). In this example, NMDA exposure, on the other hand, caused a distinct decrease in GFAP-positive cells within the dentate gyrus (D). Bar = 50 μm.