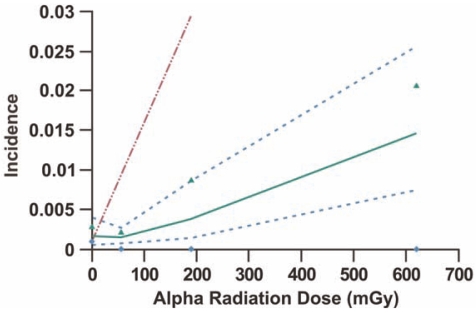
FIGURE 4.
Lower dose-portion of Figure 3 with approximate upper 95% confidence interval (triangles) for an observed incidence of zero (diamonds) added. The upper confidence interval on data points for a zero incidence is based on observing an incidence of zero with a probability of approximately 0.05 (which corresponds to an expected 3 cancer cases). With the assumed Poisson distribution, the probability of 0 events when the expected value is 3 is given by exp(-3) which equals 0.05 (rounded). The data point for the highest dose group is off scale and is not presented so that the shape of the curve at low doses is clearer.

