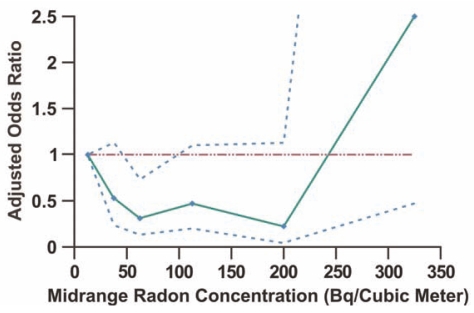
FIGURE 5.
Adjusted odds ratio for lung cancer in association with residential radon exposure based on data from Thompson et al. (2008). Odds ratio was evaluated relative to radon concentration in the range 0 to < 25 Bq m−3. Data points are plotted at the midrange of the data in Table 4 with an assigned upper bound of 400 Bq m−3 for the highest exposure level. The dashed curves are based on the 95% confidence values reported by Thompson et al. (2008). Data points were connected by straight lines. The horizontal line marks an adjusted odds ratio equaling 1.

