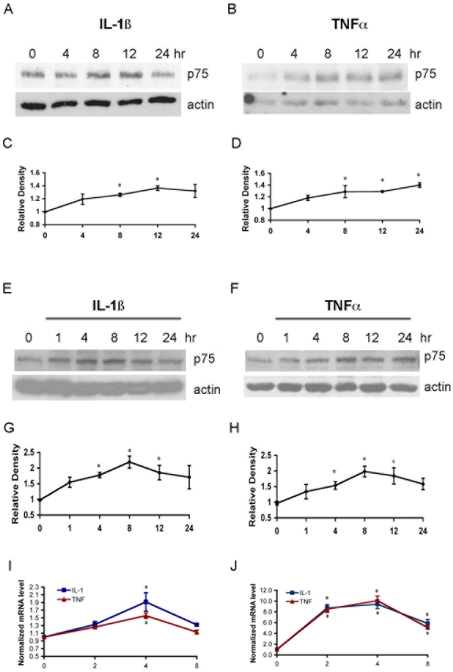
Figure 1. IL-1β and TNF-α induce p75NTR in neurons and astrocytes.
(A–D) Cultured hippocampal neurons were treated with either (A) IL-1β (10 ng/ml) or (B) TNF-α (10 ng/ml) for 4, 8, 12 or 24 h, and were then lysed and analysed by Western blot for p75NTR and actin. (C) and (D) Quantification of blots from three experiments as in (A) and (B) respectively. Densitometric values were normalized to actin and are expressed relative to the untreated cells (time 0). (E–H) Cultured hippocampal astrocytes were treated with either (E) IL-1β (10 ng/ml) or (F) TNF-α (10 ng/ml) for 1, 4, 8, 12 or 24 h, and were then lysed and analysed by Western blot for p75NTR and actin. (G) and (H) Quantification of blots from three experiments as in (E) and (F) respectively. Densitometric values were normalized to actin and are expressed relative to the untreated cells (time 0). (I and J) Quantitative real-time PCR analysis of p75NTR mRNA in hippocampal neurons (I) or astrocytes (J) treated with IL-1β or TNF-α expressed relative to untreated control cultures. The significance was determined by ANOVA with Tukey's post-hoc analysis. * indicates values significantly different from control at P<0.05.

