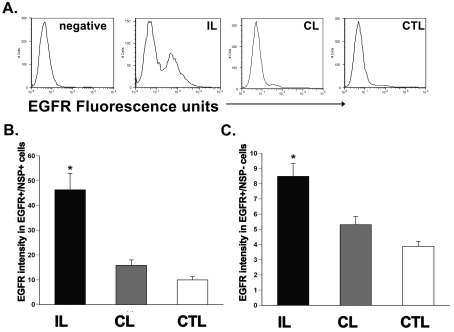
Figure 8. H/I increases the EGFR sensitivity on neural precursors in the rat SVZ.
(A) Histogram plot of EGFR intensity within the neural-precursor-positive cells from the ipsilateral, contralateral and control SVZs after 72 h recovery from H/I. (B) Quantification of the EGFR intensity (in a.u.) within the neural precursor population in the SVZ after injury. (C) Quantification of the EGFR intensity (in a.u.) within the neural-precursor-negative, putative stem-cell-encompassing population in the SVZ after injury. Values are the mean number±S.E.M. of three independent experiments with n = 6 animals per experiment. *P<0.05, measured using one-way ANOVA and Tukey's post-hoc tests. IL, ipsilateral; CL, contralateral; CTL, control.

