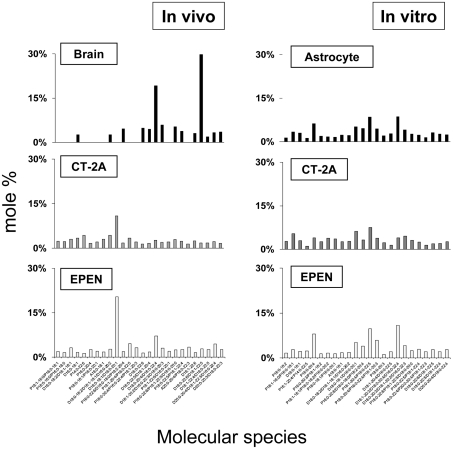
Figure 1. Distribution of EtnGpl molecular species in mitochondria isolated from mouse brain, brain tumours and cultured cells.
Molecular species values are arranged based on the mass-to-charge ratio and are expressed as percentages. The mass content of molecular species can be found in Supplementary Table S1 at http://www.asnneuro.org/an/001/an001e011.add.htm. All values are expressed as the mean of three independent mitochondrial preparations. The in vivo data were obtained from pooling six mouse cerebral cortexes or four brain tumours. The in vitro data were obtained from pooling three independent cell pellets, where each pellet was collected from six T150 culture flasks.

