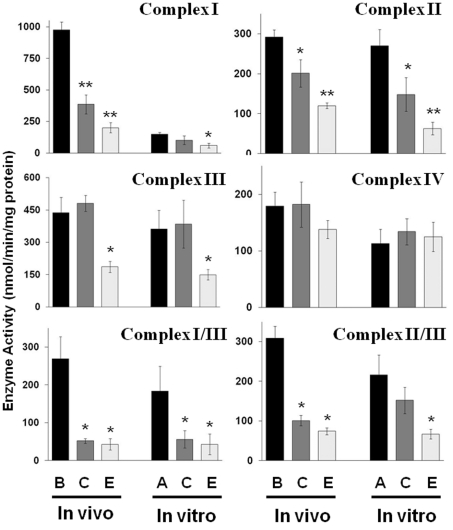
Figure 5. ETC enzyme activities in purified mitochondria from mouse brain, brain tumours and cultured tumour cells.
Enzyme activities are expressed as nmol/min per mg of protein as described in the Materials and methods section. B, C, E and A represent enzyme activities from brain, CT-2A, EPEN and astrocytes (non-tumorigenic) respectively. Other conditions are as described in the legend to Figure 1. Asterisks indicate that the activities in the brain tumour samples differ from those of the control samples (either mouse brain or astrocytes) at the *P<0.03 or **P<0.005 levels as determined using the two-tailed Student's t test. The ETC activities of tumours grown in vivo have been presented previously (reproduced from Kiebish et al., 2008a with permission; © 2008, American Society for Biochemistry and Molecular Biology, Inc.), and are presented here only for comparison with the enzyme activities of the cultured cells.

