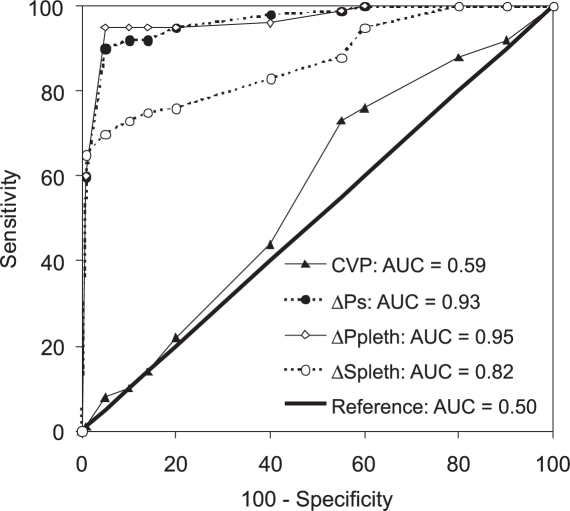
Figure 3 -.
ROC curves comparing the ability of ΔPpleth, ΔSpleth and CVP to reproduce ΔPp in discrimination of potential fluid responders (ΔPp ≥ 13%) and non-potential fluid responders (ΔPp < 13%). AUC, area under ROC curve; CVP, central venous pressure; ΔPp (%), pulse pressure respiratory variation; ΔPpleth (%), respiratory variation of plethysmographic wave amplitude; ΔPs (%), systolic pressure respiratory variation; ΔSpleth (%), plethysmographic systolic component variation; ROC, receiver operating characteristic.

