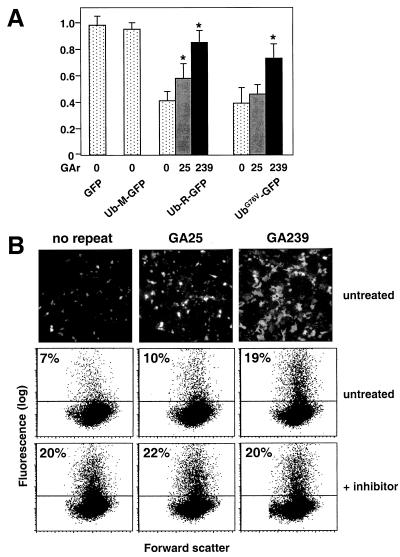
Figure 3.
Fluorimetric quantification of the inhibitory activity of the GAr. (A) Flow cytometric analysis of HeLa cells transfected with GFP-, Ub-M-GFP-, UbG76V-GFP-, and Ub-R-GFP-expressing plasmids and their GA25 or GA239 counterparts. Data are expressed as the ratio between the number of fluorescent cells in untreated samples and samples treated with 10 μM Z-L3-VS. Values shown are means ± SD from three experiments. *, Significantly different from the corresponding construct without GAr (paired t test; P < 0.05). (B) Representative low-magnification micrographs (Top) and flow cytometric analyses (Middle and Bottom) of HeLa cells expressing Ub-R-GFP, Ub-R-GFP/GA25, and Ub-R-GFP/GA239. The cells were incubated for 10 h without (Middle) and with 10 μM Z-L3-VS (Bottom). The percentages of positive cells are indicated.

