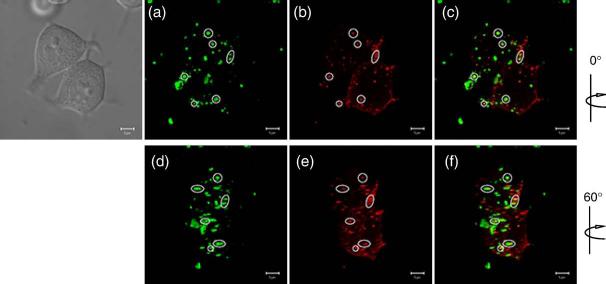
Fig. 5.
Direct colocalization study of NYAD-1 and Gag by confocal microscopy. Representative images at two different angles are shown. (a and d) FITC-conjugated NYAD-1 (green). (b and e) Gag-mStrawberry (red). (c and f) Merged views demonstrate colocalization of FITC-NYAD-1 with Gag-mStrawberry. All images were obtained from living cells 24 h post transfection. Regions of colocalization are highlighted. A DIC image is shown in the upper left corner. Data were collected from 30 cells and colocalization was assessed utilizing Zeiss imaging software (weighted colocalization coefficient was 0.402 ± 0.051).

