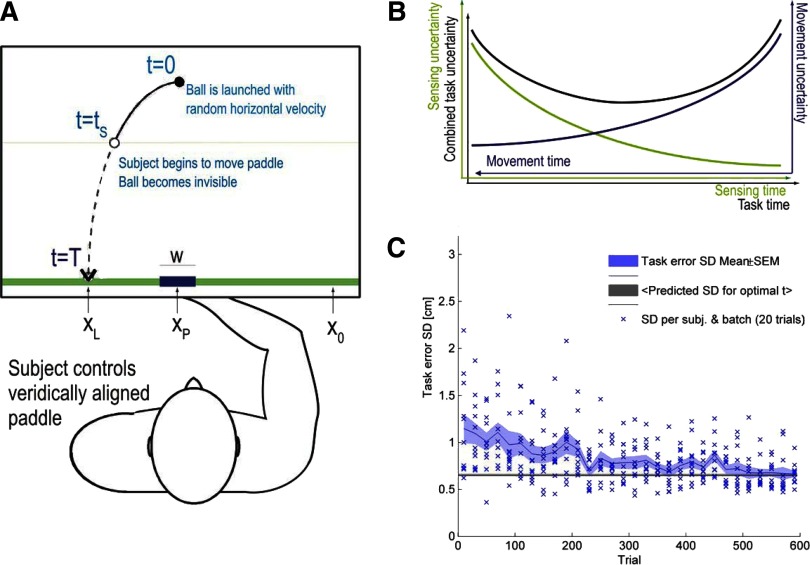
FIG. 1.
Overview of the ball catching experiment. A: the ball is launched from a central position with random horizontal velocity and is accelerated by artificial gravity toward the ground (green line); the total task time to touchdown is therefore constant. Subject controls a veridically aligned paddle of varying width w (the subjects hand center underneath the flat screen is matched to the paddle center). After the ball is launched, the subject chooses when to start moving the paddle from the far right start position (x = 0). Once paddle movement begins, the ball becomes invisible as it falls toward the ground. At all times, a thin horizontal line indicates the vertical position of the ball. A successful catch occurs when the ball center touches ground level within the width of the paddle; otherwise, to provide feedback, the ball is rendered visible and continues its trajectory until it disappears at the bottom of the screen. B: time and uncertainty relationships in the ball catching experiment. In general, sensory uncertainty (green curve and axis) decreases with time, and so does motor uncertainty (blue curve and axis). However, because of the design of the experiment, the more task time is spent sensing, the less task time remains for movement. Therefore as task time progresses and the ball approaches ground level, motor uncertainty increases. Thus the switching between sensory and motor uncertainty causes a combined uncertainty (black curve) with a globally minimal task error at the accordingly optimal switching time. C: task error (measured as ball landing position minus final paddle position) SD plotted vs. trial [batch of 20 trials for each subject (blue crosses), mean across 11 subjects (blue line), and SE (shaded region)]. The horizontal level line represents the minimal task error across subjects if they would have used the optimal switching times for each trial.

