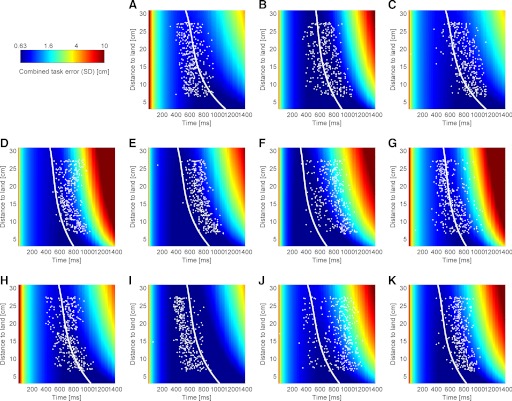
FIG. 3.
Switching times and task variability surfaces for all 11 subjects. A–K: each subplot shows the behavior for each subject and the combined variance. Individual trials of the ball catching experiment are shown as white dots, marking the distance of the paddle's initial position to the ball's landing position (i.e., the required movement distance) and the chosen switching time. The same color coding scale (log units of variance) is used for all subjects to highlight the individuality of each subject's error surface. The task variability surfaces (see text and Fig. 2) are computed from the sum of the sensor and motor error surfaces, as determined independently for each subject in the sensory and motor estimation experiment. The optimal switching time curve (white curve) lies in the valley (blue region) of the minimum of the task variability surface. Subjects in A–C, H, and I are naïve members of the laboratory.

