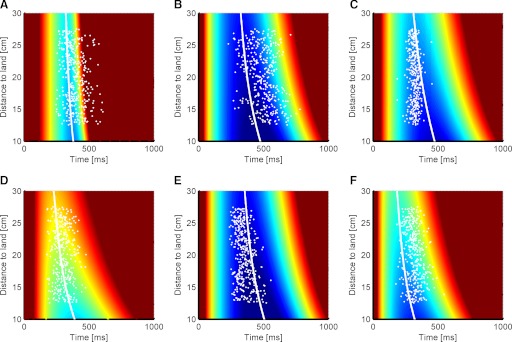
FIG. 4.

Switching times and task variability surfaces for 6 different subjects in the faster and more difficult sequence-controlled version of the experiments (A–F). Individual trials of the ball catching experiment are shown as white dots, marking the distance of the paddle's initial position to the ball's landing position (i.e., the required movement distance) and the chosen switching time together with the optimal switching time curve (white line). The same color coding scale (log units of variance) and conventions apply as in Fig. 3. Note how the overall level of the combined error surface is higher in this version of the task than that one in Fig. 3, reflecting increased difficulty as subjects have to act within higher sensory and motor uncertainties. Note subject A had difficulty in completing fast movements (<500 ms) over the full range of possible landing positions. All subjects were naïve.
