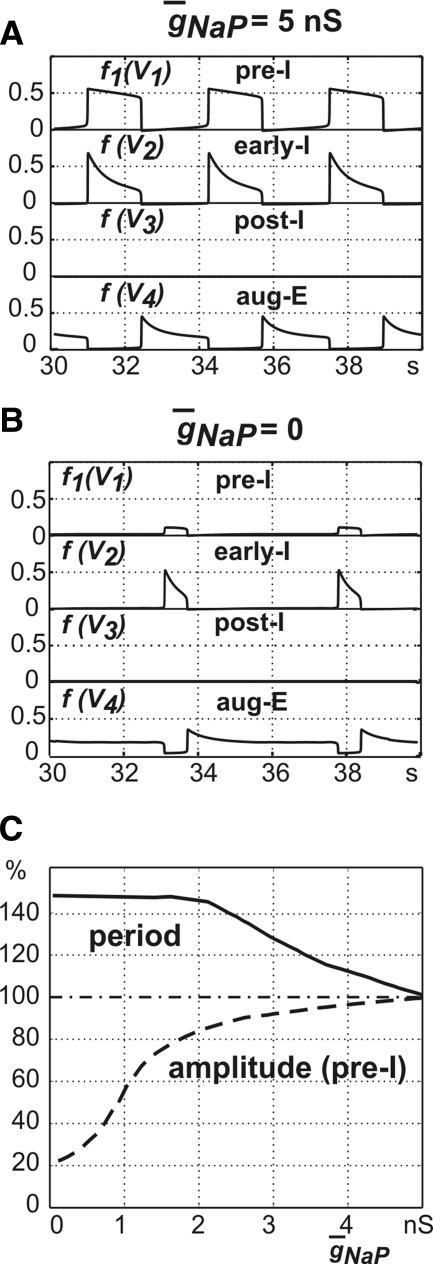
FIG. 8.
Role of INaP in the generation of the 2-phase oscillations. A: output activity of all neurons at the basic value of g¯NaP = 5.0 nS. B: output activity of all neurons with fully suppressed INaP, i.e., at g¯NaP = 0. C: relative changes in the oscillation period (solid line) and the amplitude (dashed line) with g¯NaP variation from 0 to 5 nS. The horizontal dashed-dot line shows a 100% level.

