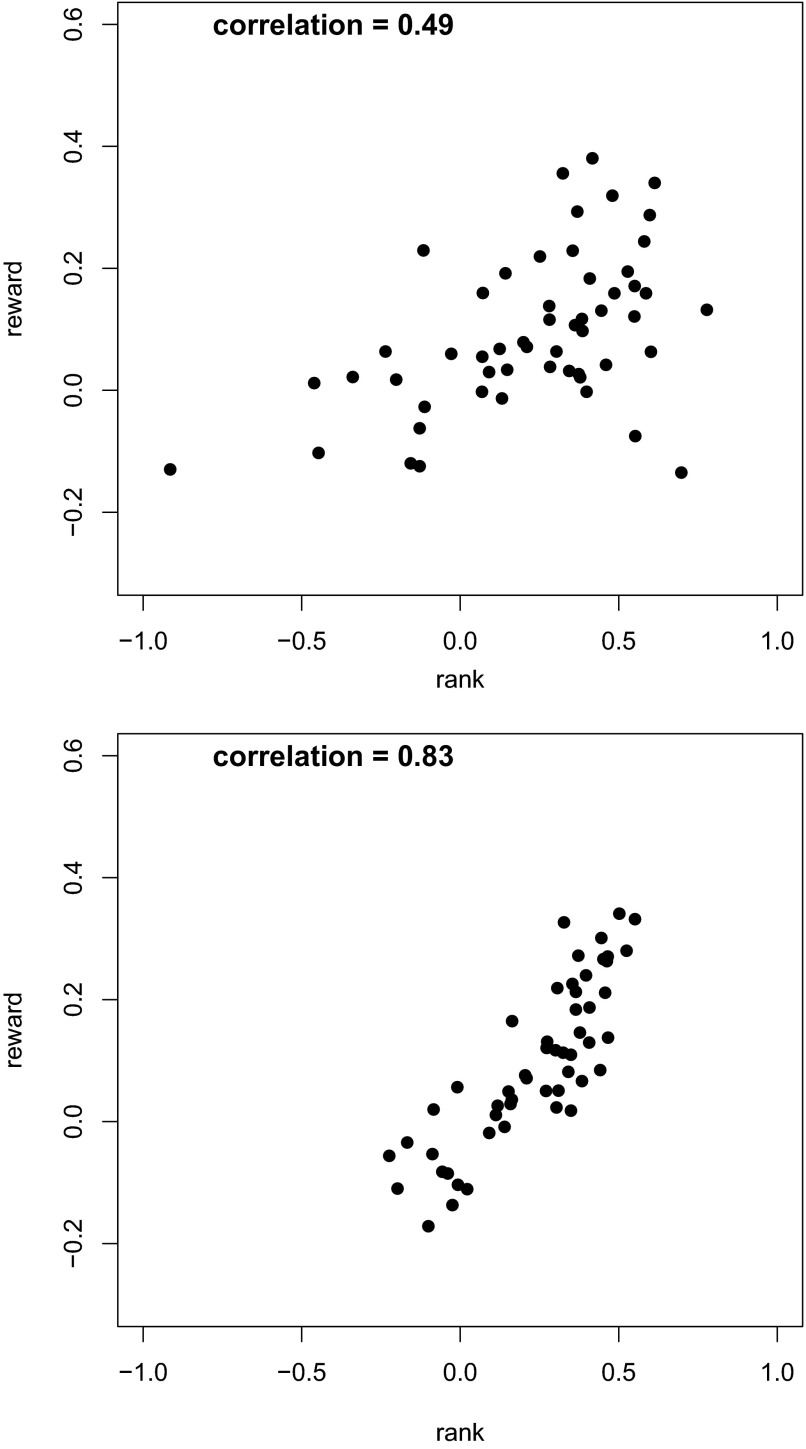
FIG. 1.
Plots of reward- vs. rank-selective indices, before and after Bayesian correction. Top: uncorrected indices. The x axis represents the index value for the the serial order saccade task. This is obtained through Irank = (f3 − f1)/(f3 + f1), where f1 and f3 were the mean firing rates measured at the times of the 1st and 3rd saccades, respectively. The y axis indicates the index of selectivity for the size of the anticipated reward: Ireward = (fb − fs)/(fb + fz) where fb and fs were the firing rates during the postcue delay period on big-reward and small-reward trials, respectively. Bottom: plot of posterior means representing values after correction for noise.

