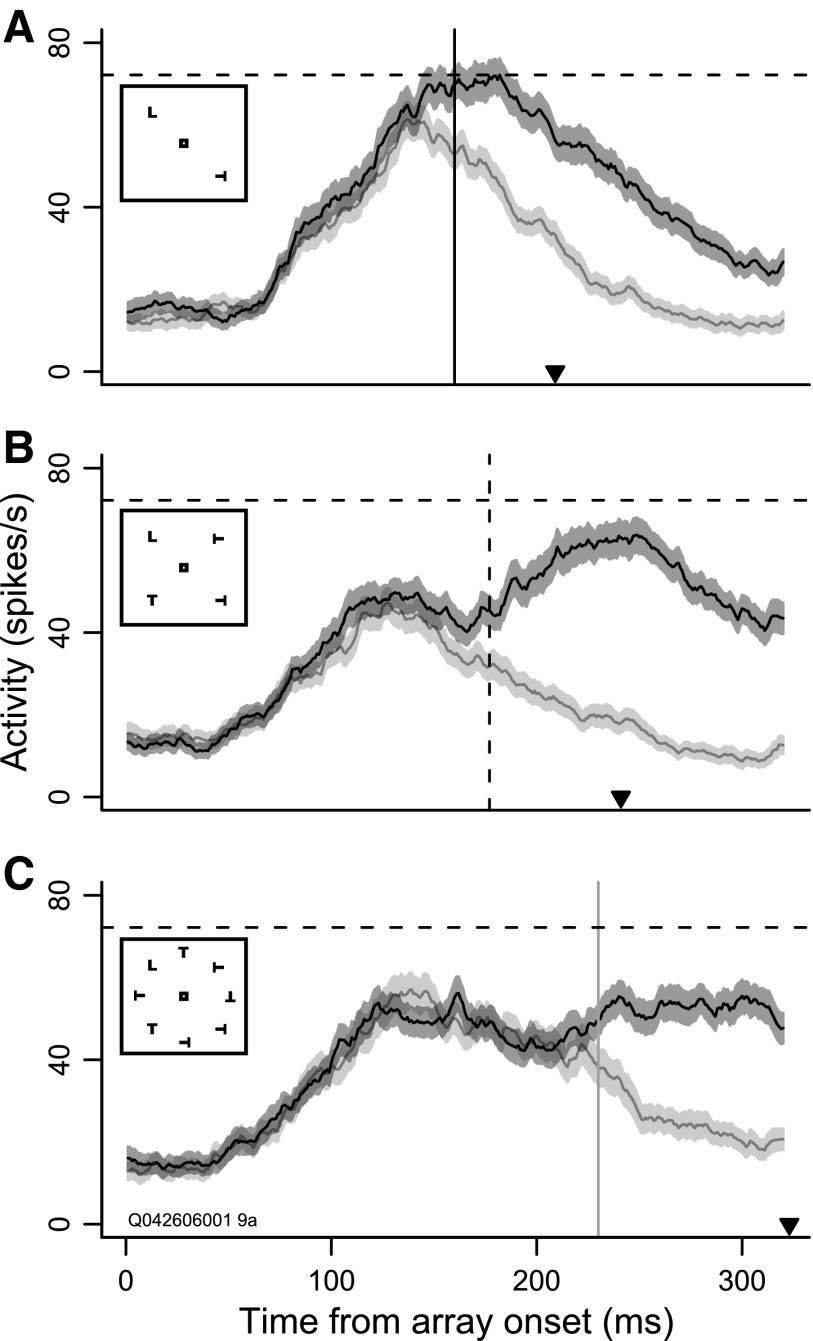
FIG. 2.
Target selection time by set size for an example neuron. A: average firing rate when the target was inside the neuron's receptive field (RF; dark band around black curve, 102 trials) and opposite the RF (light band around gray curve, 113 trials) for set size 2. Median RT is denoted by the black arrowhead. Filled bands indicate SE around the mean firing rates. The solid vertical line indicates target selection time. The dashed horizontal line indicates the peak firing rate. The inset shows an example search array of set size 2. B: the same as in A, but for set size 4 (dark, 108 trials; light, 105 trials), with the dashed vertical line indicating target selection time. The dashed horizontal line indicates the peak firing rate in A. C: the same as in A, but for set size 8 (dark, 102 trials; light, 92 trials), with the solid gray line indicating selection time and the dashed horizontal line indicating peak firing rate in A.

