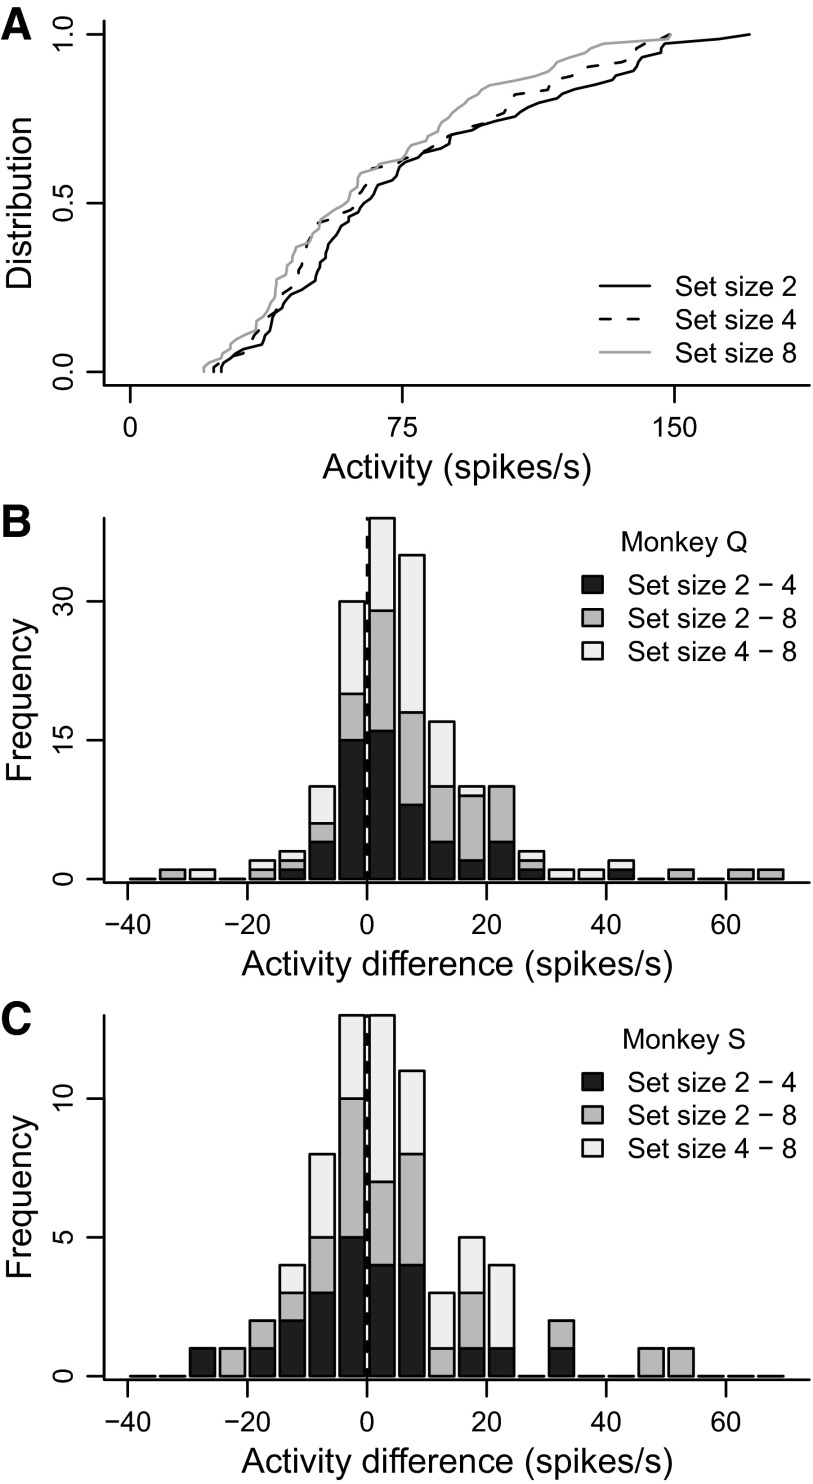
FIG. 5.
Firing rate by set size. A: cumulative distributions of firing rate across neurons for set sizes 2 (black), 4 (dashed), and 8 (gray). B: stacked histogram of differences in firing rate between set sizes 2 and 4 (dark gray), 2 and 8 (gray), and 4 and 8 (light gray), for monkey Q. Most of the histogram falls to the right of zero, indicated by the dashed vertical line. C: the same for monkey S.

