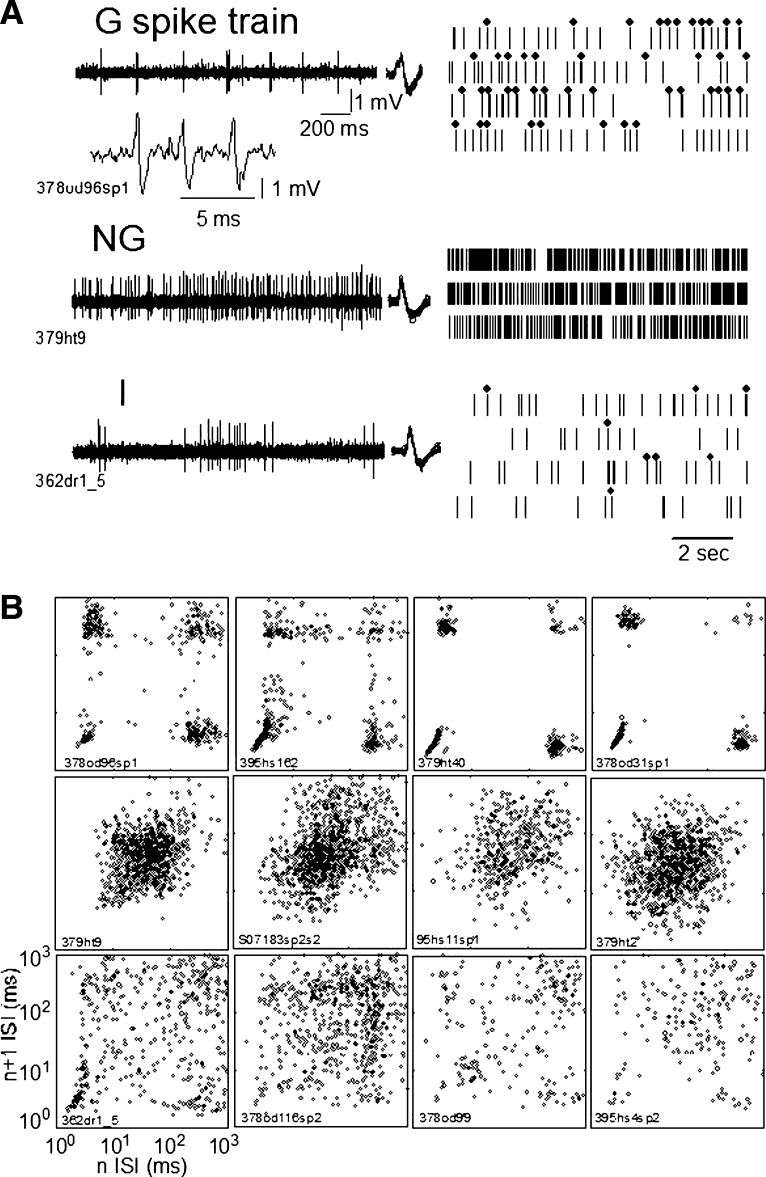
FIG. 1.
Examples of spike trains recorded during the spontaneous condition. A: spike trains of spontaneous activity are shown as the raw microelectrode signal on the left and digitized spike trains on the right. In A, row G the inset is a raw signal showing an LTS-related burst of action potentials. Dots above the digitized spike train indicate the occurrence of LTS bursts as identified by the 50–6–15 criteria (see methods, Analysis of burst activity). These data are shown in A for one each of Grouped (G), Nongrouped (NG), and Intermediate (I) categories as labeled from the top down. B: the n vs. n + 1 plot for the G spike train in A (top row) is the left plot the top row in B; similarly the n vs. n + 1 plot for NG spike train in A is shown at the left end of the middle row of B, and so on for I. From the top down these rows show 4 examples each of the G, NG, and I spike trains in the same order as in A. An alphanumeric identifier is shown with the results from each neuron.

