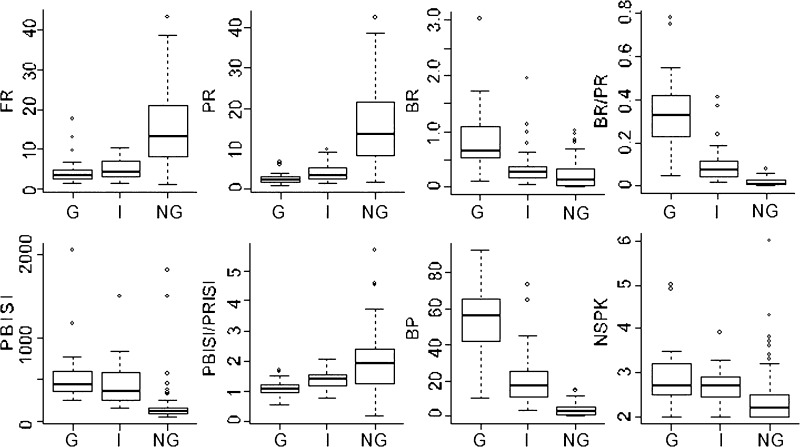
FIG. 3.
Box and whisker plots for rates, bursting, and inhibitory measures of spike trains. The heavy horizontal line is the median value, whereas the bottom and top of the box indicate the 25th and 75th percentiles and the whiskers indicate the 5th and 95th percentiles. Dots indicate values outside the 95th percentile.

