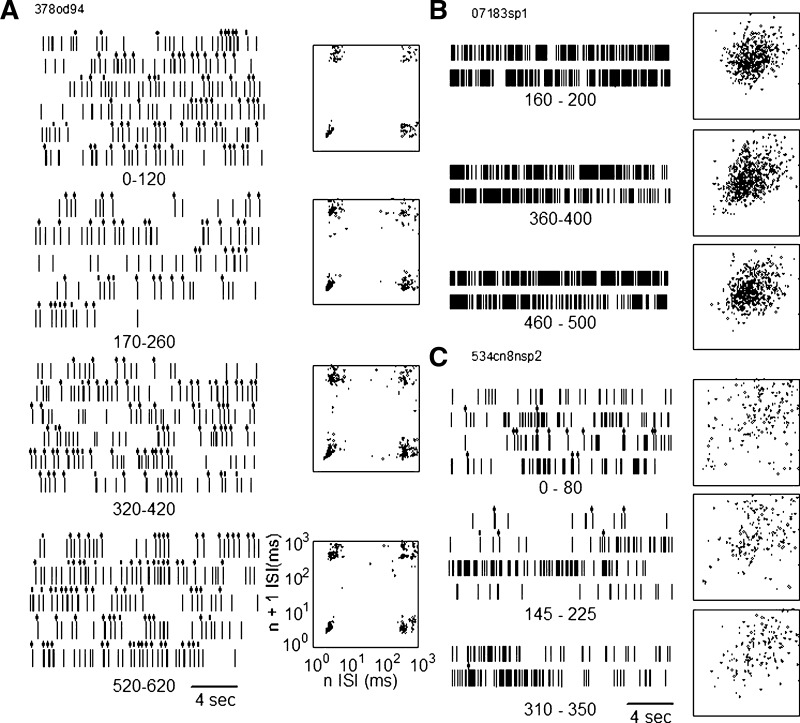
FIG. 4.
Spike trains and n vs. n + 1 distributions measured from spike trains over long samples of spontaneous activity. The spike train in the G category is shown in the left column, the NG in the top right column, and I in the bottom right column. Intervals below each raster indicate the duration of the epoch of the spontaneous epoch from which the raster was taken.

