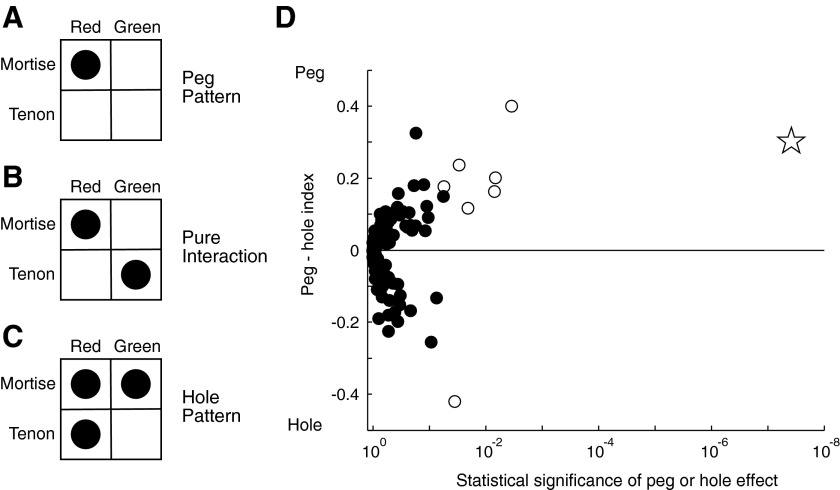
FIG. 4.
Nonlinear interaction of shape and color signals could take a variety of forms ranging from (A) a peg pattern (an especially strong response to one of the 4 stimuli) through (B) a pure interaction pattern to (C) a hole pattern (an especially weak response to one of the 4 stimuli). In each diagram, the size of the disk in each cell of the shape–color matrix indicates the strength of the neuronal response to a stimulus incorporating the corresponding shape and color. D: the value of each neuron's peg–hole index (positive for peg effects and negative for hole effects in the range +1 to −1) is plotted against a P value representing the level of significance of the combined presence of the 3 effects. A point is shown for each of 119 recorded neurons. Open symbols represent neurons in which the ANOVA revealed significant main effects of both shape and color and a significant interaction effect. The star indicates the neuron shown in Fig. 2D.

