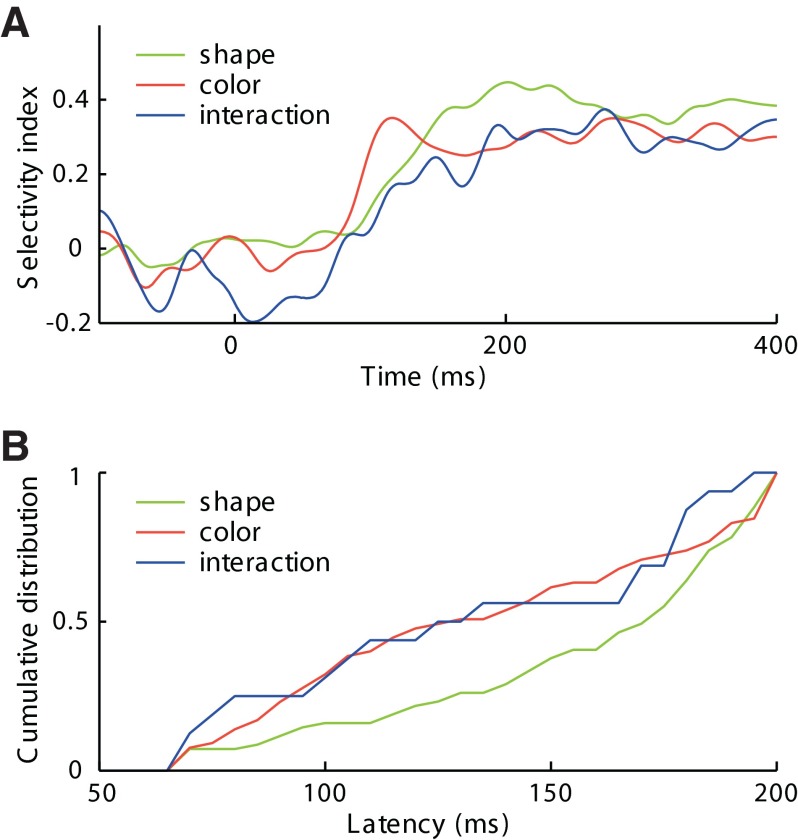
FIG. 6.
Timing of shape, color, and interaction signals. A: time course following stimulus onset of population activity discriminating between 2 shapes (among 67 significantly shape-selective neurons), between 2 colors (among 63 color-selective neurons), and between 2 diagonals of the shape–color matrix (among 16 neurons with a significant shape–color interaction effect). The signal was computed as the instantaneous mean across the population of (P − N)/(P + N), where P and N are firing rates associated with the preferred and non-preferred conditions, respectively. Each curve was smoothed by convolution with a 10 ms Gaussian kernel. B: cumulative plots represent the distribution of latencies of the shape signal (for all 67 shape-selective neurons), of the color signal (for all 63 color-selective neurons), and of the interaction signal (for all 16 neurons with significant interaction effects).

