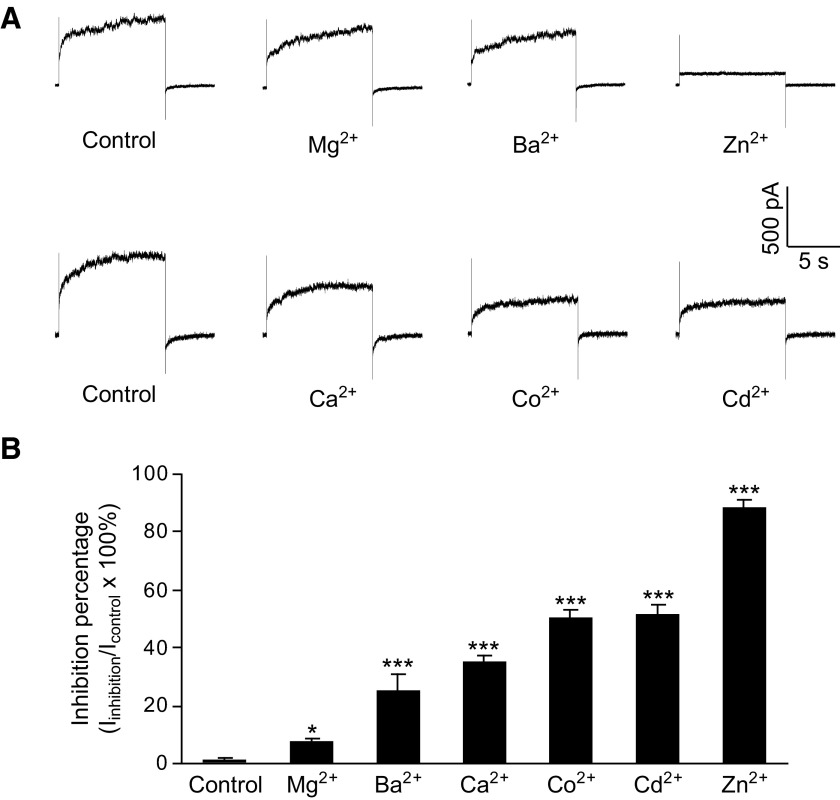
FIG. 2.
Inhibitory potencies of different divalent cations on HGJ currents. A: representative current traces of the currents induced in control medium and in medium containing 100 μM Mg2+, Ba2+, Zn2+ (top traces), or 100 μM Ca2+, Co2+, Cd2+ (bottom traces). B: average inhibition by the different divalent cations. Asterisks indicate values significantly different from control, paired t-test: *P < 0.05 and ***P < 0.001 (n = 5).

