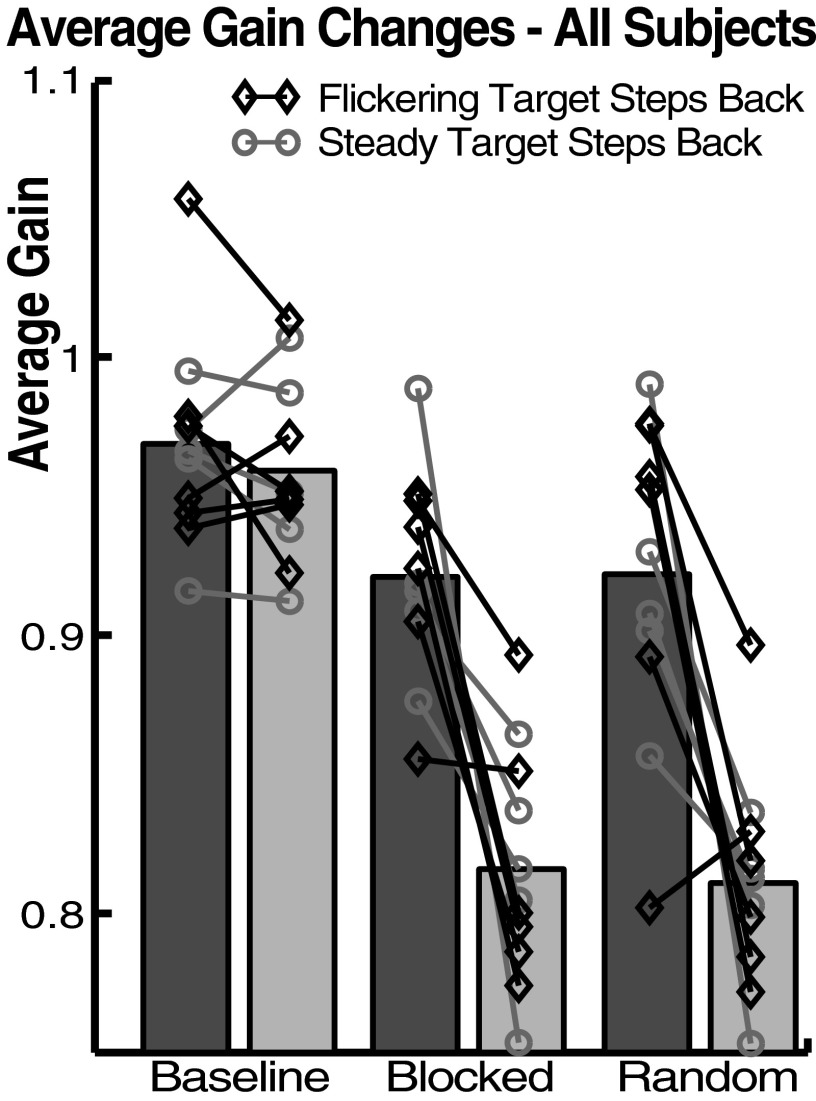
FIG. 2.
Average gain changes during experiment I. Bars represent averages across subjects without normalization. Dark bars: no-step-back trials; light bars: step-back trials. Symbols and lines represent average gains of individual subjects. Data from blocked-presentation phase are from the second half of that phase (trials 212–466).

