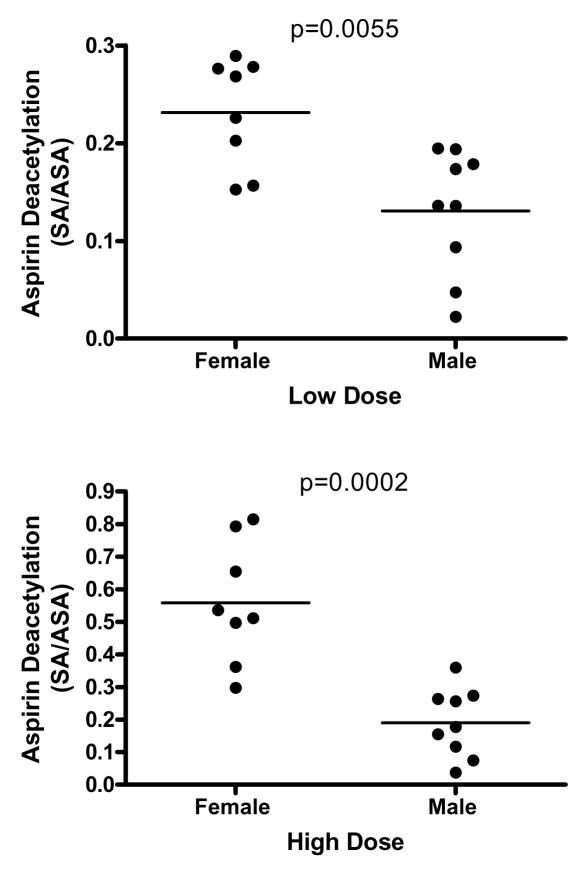
Figure 5.
Ratio of SA to ASA in plasma of young UM-HET3 mice after four weeks of consumption of food containing ASA at either 20 gm per kg food (“low dose”, upper panel) or 60 gm per kg food (“high dose”, lower panel). Each symbol represents an individual mouse, and median levels are shown by horizontal lines. Statistical significance was evaluated by the Mann-Whitney test.

