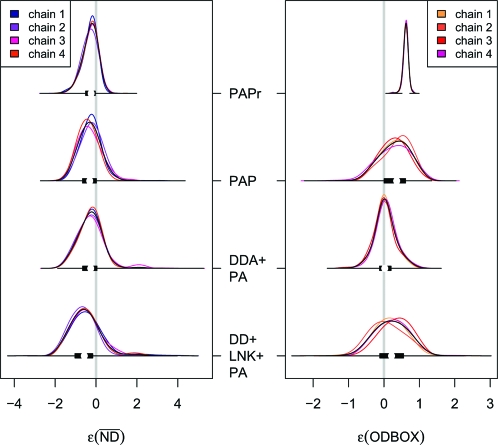
Fig. 3.
Numerical estimates, obtained from ABCμ, of the approximate posterior error densities ρ(ɛk|x0,Mi) combined with 50% box plots (black bars) for 2 of 7 summaries to quantify departures of 3 competing models of network evolution to the T. pallidum PIN dataset; PAPr employs sampling scheme RS1, whereas all others use sampling scheme RS2. ODBOX of PAPr is miniaturized by a factor of 5 to improve the visualization of differences across models for RS2. Whereas PAPr and PAP depart in ODBOX from the data, DD+LNK+PA departs (slightly) in from the observed PIN, suggesting that only DDA+PA provides an adequate fit the T. pallidum dataset.

