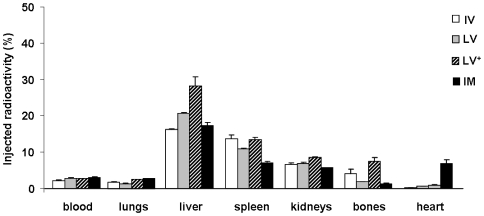
Figure 2. Effect of different routes of injection of 99mTc-labeled BMC on radioactivity tissue distribution profile.
Cells were injected post-MI via intravenous (IV) (N = 20), left ventricular cavity (LV) (N = 17), “intracoronary” (LV+) (N = 17), and intramyocardial (IM) (N = 21) routes. Data are expressed as percentage means (±SE).

