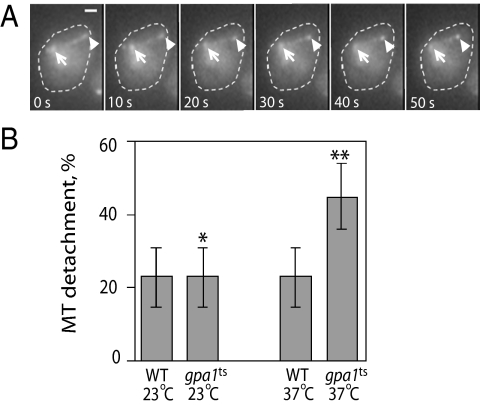
Figure 3.
Loss of microtubule–cortex contact during catastrophe. (A) Example of a shmooing cell in which the microtubule bundle loses contact with the cortex upon shrinking. The arrows mark the position of the SPB; the arrowheads mark the plus end of the microtubule. The reporter was Kar3-GFP, which decorates the entire microtubule but has greatest affinity for the plus end and the SPB (Maddox et al., 2003). Bar, 1 μm. (B) Percentage of microtubule shrinkage events resulting in loss of cortical contact. Microtubule–cortex contact was considered to be lost if the SPB did not move toward the cortex during a shrinkage event. The bar graphs indicate the mean for a given strain and condition ± the SEP. In comparison to gpa1ts at 37°C (n = 50), **p = 0.0002 for wild-type cells at 37°C (n = 59), and *p = 0.0014 for gpa1ts cells at 23°C (n = 68). For wild-type cells at 23°C, n = 90.

