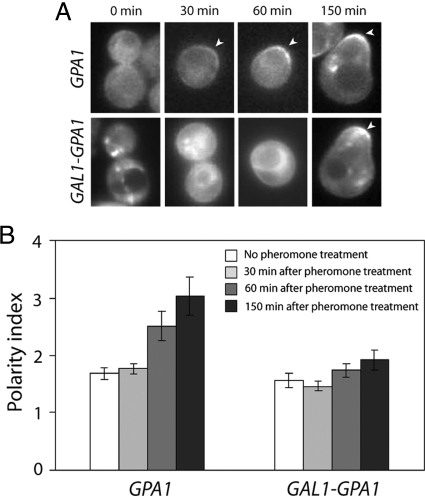
Figure 5.
Pheromone-induced polarization of Gpa1. (A) Localization of Gpa1 in pheromone-treated cells. Mid-log cells expressing Gpa1-GFP from the GPA1 promoter or overexpressing Gpa1-GFP from the GAL1 promoter were treated with pheromone and fluorescence images were acquired at the indicated time points. Cells judged to be representative of the cultures at each time point are shown. Arrowheads mark the polarized membrane localization of the reporters. (B) Quantification of Gpa1 polarization. For cells that had not yet formed a mating projection, the degree of Gpa1-reporter polarization in a given cell (polarity index) was obtained by dividing the mean signal intensity in the brightest quarter of the plasma membrane by the mean signal intensity in the opposite quarter of the plasma membrane. For shmooing cells, the polarity index was obtained by dividing the mean signal intensity in the brightest seventh of the plasma membrane by the mean signal intensity in the opposite seventh of the plasma membrane. Bar graphs represent the mean of the polarity indices cells at each time point (n = 15); error bars indicate SEM. The wild type Gpa1-GFP reporter became significantly polarized before mating projection formation (for untreated vs. pheromone-treated Gpa1-GFP cells, p = 0.0077 at 60 min and p = 0.0006 at 150 min). In contrast, cells modestly overexpressing the Gpa1-GFP reporter from the GAL1 promoter showed no significant polarization (comparing 0 min to 30, 60, and 150 min, the p values were 0.51, 0.33, and 0.10 for the Gal1-Gpa1-GFP cells, respectively).

